The Optimal Amount
of Suffering
When does losing make winning feel better?
“Being a fan of a losing team is, at its core, romantic.”— Charlotte Wilder1
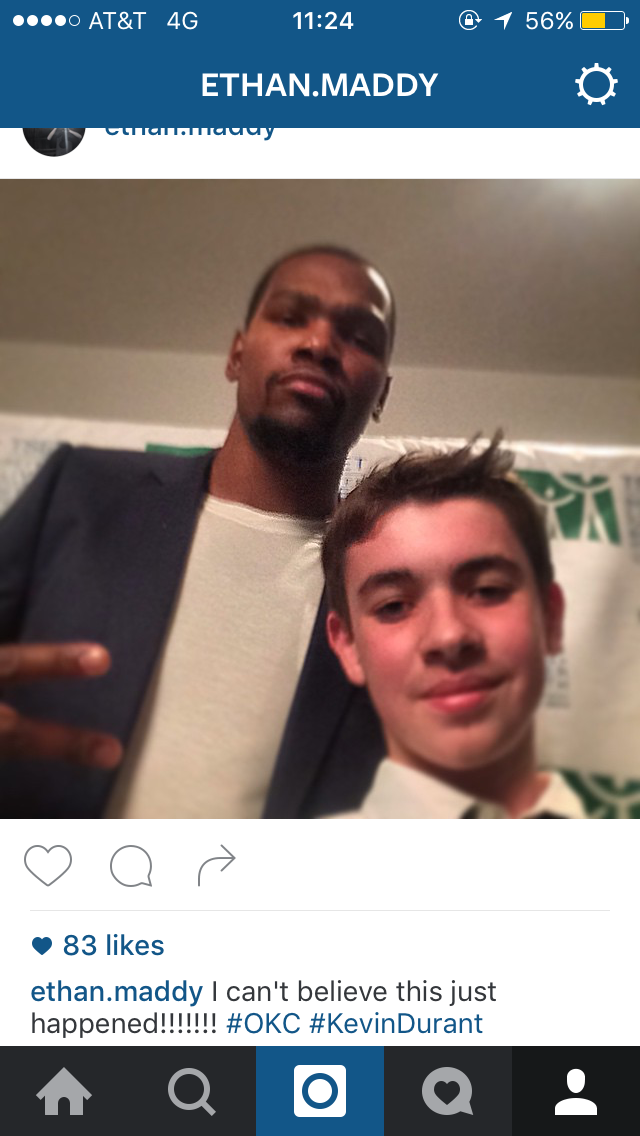
In 2014, I met Kevin Durant and posted a selfie with seven exclamation points. Less than two years later, I was burning his jersey.
In the 2016 NBA Western Conference finals, the Oklahoma City Thunder took a 3–1 series lead over the Golden State Warriors, a team who had just posted the best regular-season record in NBA history. OKC needed just one more win to reach the NBA Finals. Instead, they lost three straight.2 Then the Warriors blew a 3–1 lead of their own and lost the Finals to LeBron James and the Cleveland Cavaliers. Two weeks after that, Durant, OKC’s star and former MVP, announced he was joining the Warriors.3 I, along with all of Oklahoma, felt betrayed.
2016 West finals: Thunder led 3–1, lost in seven
- OKC
- GSW
- OKC
- OKC
- GSW
- GSW
- GSW
2016 NBA Finals: Warriors led 3–1, lost in seven
- GSW
- GSW
- CLE
- GSW
- CLE
- CLE
- CLE
Nearly a decade later, the Thunder won their first NBA championship.4 I would have gladly skipped the years of pain and suffering, but at the championship parade, those years were part of what I was celebrating. I had kept caring long enough to see my team win a title.
Losing can make a championship mean more. It can also make you stop watching. So is there a right amount of losing? An optimal amount of suffering? ESPN already ranks which fan bases suffer most.5 I care less about who suffers most than about how suffering and fulfillment trade off for one fan base over time.
So I built a way to score how a season feels and tested it on the two teams I grew up with. The Thunder lost a lot, then won it all. OU won a lot and kept coming up short.
How does being a fan feel?
Call it the Fan Suffering Index, or FSI: a score from giving up to feeling completely fulfilled.
I’m done.0
I’m conflicted.+10
This is everything.
Alienation → ambivalence → fulfillment. The −10 end is for fans who walk away, say, after their team moves to another city (sorry Seattle).6 A first title can reach +10. So can a dynasty.
What goes into that feeling?
The index has five ingredients. The records come from public data,7 and the weights come from my personal opinion, which I will defend at any bar in Chicago willing to put the Thunder game on.
- Winning. A .500 season is worth 0. A .750 season is worth +2: a very good year, but it leaves room at the top for a title. A team that wins a quarter of its games gets −2.
Why only +2?
If a great record alone could get you near +10, a championship would have nowhere left to go. A straight line through .500 → 0 and .750 → +2 works out to 4 × (2 × win% − 1), so the record by itself spans −4 (winless) to +4 (unbeaten). One honest caveat: the line is symmetric, and fans are not. An analysis of three million happiness reports from 32,000 people found that the pain of a loss is more than double the joy of a win.37 Treating wins and losses equally is generous to bad teams.
- Improvement. Up to ±3 for beating, or falling short of, your average over the last three seasons.
Why the last three seasons?
Nobody experiences a season in a vacuum. Economists call this a reference point: we feel outcomes as gains or losses relative to where we started, and losses loom larger.38 Later work argues the reference point is what we expected to happen.39 Three seasons is about one roster cycle. A 20-point jump in win percentage, about 16 more NBA wins, earns the full +3.
- Title afterglow. A championship adds +6, and the glow halves every two years.
Why does it fade?
Because joy wears off. In a classic study, lottery winners were not measurably happier than people who had not won, and they took less pleasure in everyday things.40 Two years is my estimate of how long it takes before someone asks, “Sure, but can you repeat?” Six points plus a strong record reaches the +10 cap, so a first title and a dynasty can both max out.
- Unfinished business. Every recent good season that did not end in a title costs up to 0.4, capped at −2 over five years. Call it the OU football tax.
Why punish good seasons?
If expectations are the reference point, a near-miss registers as a loss.39 A .750 season without a title counts in full. The five-season cap means frustration can dent a winning record but never erase it.
- Off-field rupture. A departure can hurt before the team plays another game. For my two teams, I assign −5 when Durant and Lincoln Riley left and −2 for the James Harden trade, each fading with a two-year half-life. These are my feelings, not estimates. Media psychologists call this a parasocial breakup,8 which is a very dignified name for setting a jersey on fire.
Add them up, keep the total between −10 and +10, and you have the index.
Is this science? Partly. The records are real and every weight is written down so it can be argued. It is also not just win percentage in a trench coat: win percentage explains about two-thirds of the score,9 and the other third is where the feelings live.
It passes the smell test, mostly. The most miserable NBA season in the data belongs to the 2011–12 Charlotte Bobcats, whose 7–59 record is the worst winning percentage in league history. Next come Houston the season it traded James Harden and Cleveland the season after LeBron James’s “Decision.”10 So departures show up even when the index only sees the scoreboard. Its biggest blind spot is the playoffs: the happiest NBA season without a title belongs to the 73–9 Warriors, who blew a 3–1 lead in the Finals.11 Golden State’s fix for that heartbreak was signing Kevin Durant about two weeks later. I’m told it helped.
The most miserable season in college football belongs to UCF’s 0–12 team in 2015. Two years later, UCF went 13–0 and threw itself a national-championship parade at Disney World.12 The index gives that season a 5.9, because UCF’s title was not official (sorry UCF fans).
Exact math and assumptions
Totals above +10 become +10. Totals below −10 become −10.
| Input | Formula | Why this choice |
|---|---|---|
| W · winning | 4 × (2p − 1), where p is season win percentage. | Anchors .500 → 0 and .750 → +2 give a slope of 2 ÷ .25 = 8, so W = 8(p − .50). Keeps a record alone between −4 and +4, leaving headroom for titles. Symmetric by choice, although losses hurt fans more than wins help. |
| M · improvement | 3 × clamp((p − prior three-season mean) ÷ .20, −1, 1). | Reference-dependent: a season is judged against recent history. A 20-point swing earns the full ±3. Requires three prior seasons, so each team’s first three seasons in the data are unscored. |
| C · title afterglow | 6 × sum of 2^(−years since title ÷ 2). | Hedonic adaptation: the glow halves every two years. Titles stack. With a strong record, one title reaches the +10 cap; in practice the cap binds only in title seasons (and for Alabama’s dynasty years). |
| U · unfinished business | .4 × sum of clamp((p − .50) ÷ .25, 0, 1) over the latest five seasons; title seasons count zero. | Expectation-based disappointment. A .750 non-title season contributes the full .4; the burden caps at 2. Winning percentage is a crude contention proxy: playoff near-misses are not coded. |
| O · off-field rupture | Sum of event size × 2^(−years since event ÷ 2). | Harden −2; Durant −5; Riley −5. Personal scenarios, not estimates, and only in the two personal charts. NBA offseason shocks enter the next season’s score; Riley enters 2021 because OU’s bowl came after he left. No league-wide inventory of heartbreak exists, so the explorer and forecast use O = 0 for everyone. |
| Bounds | Cap the total at −10 and +10. | On the field alone, the lowest reachable score is −8.6 and the highest without any title in memory is +6.6. Reaching −10 takes an off-field rupture. Zero is a net balance and can hide strong feelings pulling in both directions. |
The weights were chosen to be readable, not tuned to match fan surveys, attendance, or a ranking I wanted. Fitting emotional weights would require measuring how fans actually felt, season after season, for example by asking Wann and Branscombe’s fan-identification questions every year.41 Box scores cannot supply that. The forecast below estimates its own coefficients, but predicting the index well would not prove it measures feelings.
NBA coverage starts in 2002. Football starts in 1997: 1997–2000 come from James Howell’s historical archive.7 Oklahoma City’s history begins in 2008–09, and Seattle stays separate, of course. Football titles mean BCS or CFP winners on the field, plus both 1997 poll champions; USC’s later-vacated 2004 title is kept, because the index describes what fans lived through that January. Results are as played. NBA records are regular season only; NBA Cup finals, exhibitions, and play-in games are excluded. Football includes bowls and games against lower divisions.
The Thunder
Kevin Durant, Russell Westbrook, and James Harden made success feel natural for the Thunder in the early 2010s. We reached the Finals in 2012; surely a championship would follow. Instead, Harden was traded that October,13 and you know how 2016 went. Losing the series hurt, but Durant’s decision and his lack of transparency made it personal. He lost any goodwill he had in Oklahoma forever.
The next season, Westbrook averaged a triple-double on his way to league MVP.14 Was that season powered by spite? The Thunder won 47 games, eight fewer than the year before. Westbrook’s spite, it turns out, is great for triple-doubles and mediocre for wins and titles.
Did Durant’s exit hurt the team, or just me?
Short answer: me, definitely. The team, somewhere between seven wins per season and none, depending on which comparison you trust. The index’s departure penalty measures my reaction; the standings need a different test, built around an annoying fact: great teams usually get worse anyway. Statisticians call it regression to the mean, and it has been spoiling sports narratives since Francis Galton first described it in 1886.15 So the real question is whether OKC got worse than similar teams did over the same seasons. The tool for that is called difference-in-differences, the same design economists used to study New Jersey’s minimum-wage increase at fast-food restaurants.16 I also happened to use it for my master’s dissertation back in 2023.
The catch is finding similar teams. The five whose records looked most like OKC’s all lost a star of their own. The summer Durant left, Tim Duncan retired (his last game was a playoff loss to the Thunder) and Dwyane Wade left Miami.17 The next summer, the Clippers traded Chris Paul, Memphis let Zach Randolph walk, and Indiana traded Paul George to… Oklahoma City.18 A comparison group that is busy losing its own stars cannot tell you what losing a star did.19 So I threw out every team that lost or added a recent All-Star between the summer of 2016 and the end of the 2018–19 season.20 Twenty teams made a move like that. Of the eight teams left, the five whose records looked most like OKC’s became the comparison group.
OKC fell behind the teams that stood pat
The record, season by season
Who got left out, and does the answer hold up?
Against teams that stood pat, OKC won about seven fewer games per season (8.7 points of win percentage). Every version of the screen I tried lands between 5.6 and 10.1 points worse. So Durant’s exit hurt the team. Probably.
Probably, because none of those eight teams were as good as OKC, and great teams fall back toward .500 on their own. Since 2002, NBA teams that won about two-thirds of their games over four seasons, as OKC did, saw their win percentage fall 15.4 points over the next three. OKC’s, minus Durant, fell 8.2.21 Next to teams that good, the Thunder held up better than most.
No team was both as good as OKC and quiet that summer, so there is no perfect comparison, only two imperfect ones. One says Durant cost the Thunder about seven wins per season. The other says he cost them nothing they were not about to lose anyway. The truth is somewhere in between, which is the long way of saying the classic economist line: it depends. So, the team or just me? The standings took a dent. Oklahoma took the rest.
The long way to +10
Durant’s exit was not the bottom. In July 2019, the Thunder traded Paul George to the Clippers and Westbrook to Houston and started over.22 Then came the part of the recipe nobody orders: 22–50, 24–58, and 40–42, three straight losing seasons. The George trade had brought back a 20-year-old guard named Shai Gilgeous-Alexander. In 2025 he was the league’s MVP, and the Thunder went 68–14 and won the title.23
Three losing seasons, then everything
According to the index, the first season without Durant felt almost as bad as the losing years that came later: a 47-win season with an MVP scores −5.6 once the betrayal is counted, next to −6.1 for 22–50.
Thunder seasons and events
Results plus my assumed penalties: −2 for the Harden trade and −5 for Durant, each fading with a two-year half-life. NBA seasons are labeled by the year they end, and a summer departure counts from the next season.
OU
I was eleven months old when OU won its last national championship in January 2001.24 Since then, there have been title games, Heismans, and enough winning football to make complaining about it seem unreasonable.
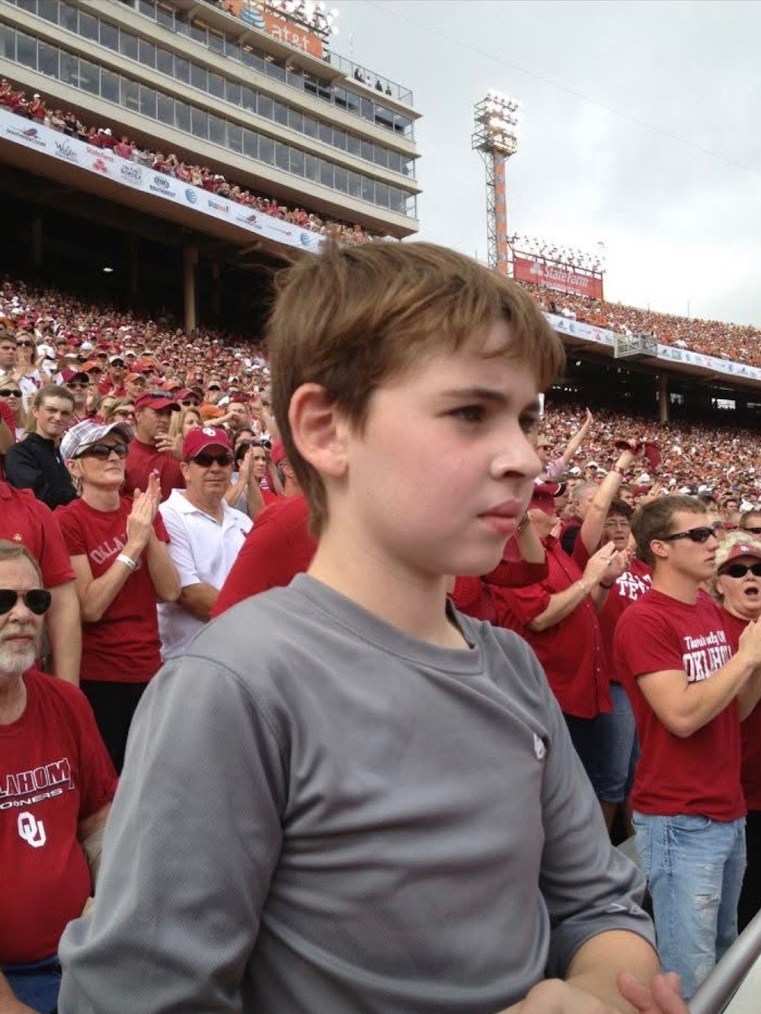
The problem with being good every year is that each year gives you a new reason to think this might finally be it. Think: a 31–17 halftime lead in the 2018 Rose Bowl that ended in a double-overtime loss to Georgia.26
Then, in my last year at OU in 2021, Lincoln Riley left for USC in the middle of the night.27 Riley took assistant coaches with him, including his defensive coordinator, Alex Grinch,28 and many standout players, most notably Caleb Williams, who would go on to win the Heisman the next season.29 Riley’s exit felt eerily like Durant’s. We had been imagining our future around someone who was now building it somewhere else. OU finished that 2021 season 11–2. That record tells you very little about how the end of that year felt.
Eleven wins. Still a reason to feel abandoned.
OU went 11–2 in 2021, and the index barely noticed: five straight seasons above .800 without a title max out the OU tax. Then add my assumed penalty for Riley.
OU seasons and events
The chart starts with the 2000 title at +10 and never gets back. The −5 is my assumption, not an estimate of every fan’s reaction. Riley enters the 2021 score because OU’s bowl game came after he left.
Did Riley’s exit hurt the team?
On the field, yes, at least at first. OU’s comparison group had the same problem as OKC’s: its closest match, Notre Dame, lost Brian Kelly to LSU about a day after Riley left.30 So I applied the same fix and threw out every program whose head coach left between the start of the 2021 season and the end of 2023.31 Sixty-four programs made a change like that, which tells you all you need to know about job security in college football. Against the five closest of the sixty-one that kept their coach, OU’s 6–7 season in 2022 came in about four wins short of expectation, and 2023 landed right back on the expected path. Every version I tried puts 2022 somewhere between 27 and 36 points below expectation.
One lost season, then back on schedule
The record, season by season
Recruiting class rank (247Sports Composite)
Who else was going through something, and does the answer hold up?
Recruiting, the damage fans feared most, largely did not happen. OU’s 2022 class still finished eighth nationally, and the 2023 class, Brent Venables’s first full one, ranked fifth.32 Venables came from Clemson, one of the comparison programs that kept its head coach,33 so part of OU’s recovery was imported from the control group.
Then something funny happened. OU went 6–7 again in 2024, its first year in the SEC, and 10–3 in 2025. On results alone, the index scores that 10–3 at +4.0, OU’s best since 2004 and higher than any of the 12–2 seasons in between. Same program, fewer wins, lower bar.
So what is the optimal amount of suffering?
The index has an answer, and OU just gave it away. A bad season helps in exactly one way: it lowers the bar.
To show how far that goes, I created a hypothetical NBA team and gave it three different run-ups to winning a ring: no losing seasons, one, or three.
Suffer briefly
Each bar is one season on the index, and the last bar in each panel is the title season. Hollow circles are seasons that score exactly 0; the dashed line is the seven-season average.
With no losing seasons, contending without winning scores zero: six straight 53-win seasons earn +1.2 for winning, −1.2 in unfinished business. Good record, zero joy. OU fans will recognize the feeling. One losing season changes the title itself. The index measures every season against the three before it, so after a bad year the title counts as a big jump and clears some unfinished business, lifting it from 8.5 to the maximum of 10.
That perfect ending costs something: one losing season drags the seven-year average from +1.2 to +0.6. More losing buys nothing, because the title is already at the top of the scale; three bad years just sink the average to −0.7. If fans kept a running average, the optimal amount of suffering would be zero. We don’t.
Memory keeps highlights, not averages. In a famous experiment, people chose to repeat a longer cold-water ordeal over a shorter one, as long as the longer one ended a little less painfully. Colonoscopy patients remembered their procedures by the worst moment and the last few minutes, not by how long they lasted.34 Psychologists call this duration neglect. If fandom works the same way, the number of bad seasons matters less than how bad the worst one was and how the story ended. (For the record, the 2021–22 Thunder were a colonoscopy.) Allen Parducci argued back in 1968 that how good something feels depends on where it falls within the range of what you have lived through.35 The 24–58 season is part of why 68–14 felt like everything.
The catch is that you have to still be there at the end. On the field alone, the index cannot push a fan below −8.6; getting all the way to “I’m done” takes a betrayal or a moving van.
So here is my answer. The optimal amount of suffering is just enough to reset your expectations. In the index, one losing season does it. The Thunder, being thorough, had three. Every season beyond that is not character building. It is just suffering.
The Thunder’s title mattered because we cared through the trades and the betrayals. That was the romantic part.
Try it on your team
My answer comes from one made-up team. Real fan bases have been running the experiment for decades, mostly without their consent. Find the season your team hit bottom, and count how long it took to climb out.
When did your team become worth watching again?
Compare teams and seasons, or scan a whole league at once. These scores use results only, so every team gets the same treatment and nobody is penalized for my personal betrayals. Try the Warriors through 2018 to see what a dynasty does to the scale, or compare OU with Texas if you enjoy other people’s pain.
The league’s decade of highs and lows
Season-by-season records and events for the selected team
Next season
The index can also forecast. Tested on every season since 2012, using only the seasons before it, the forecast beats “same as last year” by about a sixth, and it barely beats a one-line rule that drifts every team back toward average. Sports are mostly regression to the mean; FiveThirtyEight’s Elo ratings literally pulled every NBA team a quarter of the way back to average each offseason.36 For OU’s 2026 season, it says +0.5, with a band from −4.1 to +4.9. This is a statistical way of saying “somewhere between bad and good.” The model has clearly met OU.
Methods: departures, forecast, recruiting
Departures. The relative change is (team’s change) − (comparison teams’ change), from the four seasons before a departure to the seasons after. Comparison teams are the five closest matches on pre-departure win percentage, equally weighted, with complete records required and the destination team excluded. For Durant, the pool is also screened: a team is out if it lost or added a player named to either of the two previous All-Star Games between April 2016 and April 2019, which leaves eight teams. I added the screen after the first version, on design grounds (a comparison team should not share the treatment), and the original design is still reported next to it. A team-and-season fixed-effects regression reproduces each estimate exactly. Placebo tests hand the departure to every other team in the pool and rerun everything.42 Otherwise, each headline design stays the headline even where a check looks cleaner, because switching after seeing the answer is how forking paths creep in.43 With one treated team per case, conventional standard errors would manufacture false precision, so none are reported.44 A causal reading would require that each team would have tracked its comparison group without the departure, with no spillovers; a close fit before the departure does not establish that.45 When the comparison teams are not as good as the treated team, as with Durant, the regression-to-the-mean benchmark makes the opposite assumption, and the truth likely lies between the two.
Forecast. A separate pooled regression for each sport predicts next season’s results-only FSI from this season’s win percentage, improvement, title afterglow, and unfinished business. Every test year is predicted by a model fit only on seasons whose outcomes were already known: an expanding-window, rolling-origin test, with no random train/test split.46 The model has to beat three benchmarks: the league average, “same as last season,” and a one-variable drift-to-average rule. It beats all three, but only narrowly beats the last. An earlier version also fed in the total score, which is nearly the sum of the parts. The predictors were almost perfectly collinear (variance inflation above 200), which made every coefficient unreadable, so the total was dropped. Accuracy did not change. The 80% band adds the 10th and 90th percentiles of past forecast errors, a distribution-free idea close to split-conformal prediction,47 checked by rebuilding it each year from earlier errors only. The model ignores rosters, injuries, recruiting, betting markets, and games already played this season.
Recruiting. 247Sports Composite team rankings, 2017–2024, top 50 classes each year, used descriptively. Per-recruit files I checked had wrong star ratings and class years for OU’s key 2022–23 recruits, so I did not use them.
The technical report has every table, check, and figure, including the full list of screened teams, what happened to Thunder attendance, and the unscreened comparison run on ten other famous exits. The R scripts below rebuild everything from public sources.
Notes
- Charlotte Wilder, “Sports dynasties are good,” The Wilder Things. The opening quote and the nudge to think about the romance of losing; her essay also proposes a Fandom Romance Index. ↩
- ESPN, “Warriors 96–88 Thunder,” Game 7 of the 2016 Western Conference finals, May 30, 2016. Golden State was the tenth team in NBA history to come back from 3–1 down. ↩
- Kevin Durant, “My Next Chapter,” The Players’ Tribune, July 4, 2016. The jersey burning is my own recollection. ↩
- NBA.com, “NBA Finals Game 7 live blog,” June 2025. ↩
- ESPN, “Sports Misery Index: How miserable is each NBA fan base?” (2019), the documented version compared here; ESPN also published a 2025 interactive, and not every distinction may apply to every revision. ESPN counts titles, playoff runs, heartbreaks, and rivals’ success to rank who suffers most. The index skips rivals and single heartbreaks, rewards improvement, and keeps departures separate. Bill Simmons’s “The 13 Levels of Losing,” ESPN Page 2 (2002), updated as “Levels of Losing 2.0” (2007), covers the same ground with more feeling. ↩
- ESPN, “SuperSonics, Seattle reach last-minute settlement,” July 2, 2008. The settlement cleared the team’s move to Oklahoma City; the Sonics name and colors stayed in Seattle. ↩
- SportsDataverse, “Public ESPN schedule archives,” downloaded September 23, 2026: NBA seasons 2002–2026, football 2001–2025. James Howell, “Historical College Football Scores,” for FBS football 1997–2000. Championship coding checked against NBA champion history and CFP history. ↩
- Jonathan Cohen, “Parasocial Break-Up from Favorite Television Characters: The Role of Attachment Styles and Relationship Intensity,” Journal of Social and Personal Relationships 21, no. 2 (2004): 187–202. doi.org/10.1177/0265407504041374. ↩
- Adjusted R² of 0.68 in the NBA and 0.69 in football, from a regression of every scored season’s results-only index on its win percentage. Improvement, title afterglow, unfinished business, and the ±10 cap account for the rest. ↩
- Rankings from this analysis’s results-only scores. Guinness World Records, “Worst winning percentage by an NBA team (season)” (Charlotte, .106); NBA.com, “Legendary Moments: LeBron James’ ‘The Decision’” (July 8, 2010); NBA.com, “Nets acquire James Harden” (January 2021). ↩
- ESPN, “Cavaliers 93–89 Warriors,” Game 7 of the 2016 NBA Finals, June 19, 2016. Golden State became the first team to lose the Finals after leading 3–1. Durant’s announcement followed fifteen days later. ↩
- ESPN, “UCF honors ‘national championship’ with parade at Walt Disney World,” January 2018. The index counts only BCS and CFP titles. ↩
- ESPN, “James Harden traded to Rockets,” October 27, 2012. ↩
- ESPN, “Russell Westbrook caps historic season with MVP award,” June 2017: 31.6 points, 10.7 rebounds, and 10.4 assists a game, with 42 triple-doubles, breaking Oscar Robertson’s record of 41. Wins are from this analysis’s data. ↩
- Francis Galton, “Regression Towards Mediocrity in Hereditary Stature,” Journal of the Anthropological Institute of Great Britain and Ireland 15 (1886): 246–263. For sports specifically, Teddy Schall and Gary Smith, “Do Baseball Players Regress toward the Mean?” The American Statistician 54, no. 4 (2000): 231–235, doi.org/10.1080/00031305.2000.10474553. ↩
- David Card and Alan B. Krueger, “Minimum Wages and Employment: A Case Study of the Fast-Food Industry in New Jersey and Pennsylvania,” American Economic Review 84, no. 4 (1994): 772–793. NBER working paper. ↩
- ESPN, “Tim Duncan retires after 19 seasons, 5 NBA titles,” July 11, 2016; ESPN, “Dwyane Wade commits to Bulls, thanks Heat Nation,” July 2016. ↩
- ESPN, “Doc Rivers: Chris Paul departure ‘big loss’,” June 2017; ESPN, “Kings land free agents George Hill and Zach Randolph,” July 2017; ESPN, “Pacers agree to send All-Star Paul George to Thunder,” June 30, 2017. ↩
- Jeffrey M. Wooldridge, Introductory Econometrics: A Modern Approach, 7th ed. (Cengage, 2020), chapter 3, on multicollinearity. The extreme case is exact: if every comparison team had lost a star in the same season, “lost a star” would be identical to that season’s fixed effect, and a regression could not estimate both. ↩
- A move is a trade, free-agent signing, or retirement of a player named to either of the two All-Star Games before it, from the end of the 2015–16 season through the end of 2018–19. Moves come from Wikipedia’s lists of 2016–17, 2017–18, and 2018–19 NBA season transactions; selections from its List of NBA All-Stars. The eight teams that stood pat: Brooklyn, Charlotte, Detroit, Milwaukee, Orlando, Phoenix, Portland, and Washington. Detroit made the cut on a technicality: Blake Griffin arrived in January 2018, but his last All-Star Game had been in 2015. Counting him (a three-game rule) moves the answer from −8.7 points to −5.6. ↩
- From this analysis’s data: 41 stretches of four seasons followed by three, from 16 teams, that started within three points of OKC’s .668 win percentage from 2012–13 to 2015–16. They fell 15.4 points on average; OKC fell 8.2. The difference-in-differences assumes OKC would have moved in parallel with its comparison teams; this benchmark assumes it would have moved like other teams at its level. Under some conditions the two answers bracket the truth: Joshua D. Angrist and Jörn-Steffen Pischke, Mostly Harmless Econometrics (Princeton University Press, 2009), section 5.3; Peng Ding and Fan Li, “A Bracketing Relationship between Difference-in-Differences and Lagged-Dependent-Variable Adjustment,” Political Analysis 27, no. 4 (2019): 605–615, doi.org/10.1017/pan.2019.25. ↩
- Oklahoma City Thunder, “Thunder Acquires Gilgeous-Alexander, Gallinari and Five First-Round Draft Picks,” July 10, 2019; NBA.com, “Report: Russell Westbrook traded to Rockets for Chris Paul,” July 2019. Records are from this analysis’s data. ↩
- NBA.com, “For Shai Gilgeous-Alexander, Kia MVP just another win on the way toward title goals,” May 2025. ↩
- Sooner Sports, “OU’s January 3, 2001 national championship.” ↩
- ESPN, “Oklahoma 63–21 Texas,” October 13, 2012; ESPN, “Texas A&M 41–13 Oklahoma,” Cotton Bowl, January 4, 2013, in which Manziel set an FBS bowl record with 229 rushing yards. Photo: family photo from the game. ↩
- Sooner Sports, “Rose Bowl recap,” January 1, 2018. ↩
- USC Athletics, “Lincoln Riley named USC head coach,” November 28, 2021. ↩
- Sports Illustrated, “Report: Oklahoma DC Alex Grinch Among Assistants to Follow Lincoln Riley to USC,” November 29, 2021; USC Athletics, “Full-Time Assistant Coaching Staff Named by New USC Football Head Coach Lincoln Riley,” January 10, 2022. ↩
- Yahoo Sports, “Ex-OU recruit Malachi Nelson commits to Riley and USC,” November 30, 2021; ESPN, “Five-star QB Malachi Nelson among Oklahoma football decommits,” November 2021; USC Athletics, “National Signing Day recap,” February 1, 2022; Heisman Trophy, “Caleb Williams wins the 2022 Heisman.” ↩
- FOX Sports, “LSU hires Brian Kelly away from Notre Dame after a decade,” November 2021 (“the second massive coaching change of the week, after Riley jetted to Southern California on Sunday”). Cincinnati, another program in my first comparison group, lost Luke Fickell to Wisconsin a year later and went 3–9 in 2023, which is where most of my first version’s 9.2-point rebound in 2023 came from: Sports Illustrated, “Luke Fickell leaves Cincinnati for Wisconsin,” November 28, 2022. ↩
- A departure is any head coach leaving (fired, resigned, retired, hired away, or died) from the first week of the 2021 season through the 2023 title game. Departures come from the coaching-change tables on Wikipedia’s 2021, 2022, and 2023 FBS season pages. Coordinators do not count, so Clemson stays in even though Brent Venables left it for OU. The rule has a cost: coaches fired in 2022 or 2023 were often fired for losing, so dropping their programs can make the comparison group look a little better than it was. Screening only the 2021–22 hiring cycle, the one Riley left in, avoids that and lets Cincinnati back in: 2022 still lands 28.8 points below expectation, and 2023 becomes an 11.2-point rebound. ↩
- 247Sports, “2022 Composite Team Rankings” and “2023 Composite Team Rankings”; OU’s 2017–2024 ranks from the same pages. ↩
- ESPN, “Oklahoma hires Clemson defensive coordinator Brent Venables,” December 5, 2021. ↩
- Daniel Kahneman, Barbara L. Fredrickson, Charles A. Schreiber, and Donald A. Redelmeier, “When More Pain Is Preferred to Less: Adding a Better End,” Psychological Science 4, no. 6 (1993): 401–405, doi.org/10.1111/j.1467-9280.1993.tb00589.x; Donald A. Redelmeier and Daniel Kahneman, “Patients’ Memories of Painful Medical Treatments,” Pain 66, no. 1 (1996): 3–8, doi.org/10.1016/0304-3959(96)02994-6. ↩
- Allen Parducci, “The Relativism of Absolute Judgments,” Scientific American 219, no. 6 (1968): 84–90. ↩
- FiveThirtyEight, “How We Calculate NBA Elo Ratings” (Internet Archive copy; FiveThirtyEight’s own links now redirect elsewhere): between seasons, each rating kept 75% of its value and moved 25% toward the league mean. ↩
- Peter Dolton and George MacKerron, “Is Football a Matter of Life and Death – Or Is It More Important than That?” NIESR Discussion Paper 493 (2018); summary in University of Sussex, “Football makes fans less happy” (2018). Data: about three million responses from 32,000 people on the Mappiness app. ↩
- Daniel Kahneman and Amos Tversky, “Prospect Theory: An Analysis of Decision under Risk,” Econometrica 47, no. 2 (1979): 263–291. doi.org/10.2307/1914185. ↩
- Botond Kőszegi and Matthew Rabin, “A Model of Reference-Dependent Preferences,” Quarterly Journal of Economics 121, no. 4 (2006): 1133–1165. doi.org/10.1093/qje/121.4.1133. ↩
- Philip Brickman, Dan Coates, and Ronnie Janoff-Bulman, “Lottery Winners and Accident Victims: Is Happiness Relative?” Journal of Personality and Social Psychology 36, no. 8 (1978): 917–927. doi.org/10.1037/0022-3514.36.8.917. ↩
- Daniel L. Wann and Nyla R. Branscombe, “Sports Fans: Measuring Degree of Identification with Their Team,” International Journal of Sport Psychology 24 (1993): 1–17. ↩
- Alberto Abadie, Alexis Diamond, and Jens Hainmueller, “Synthetic Control Methods for Comparative Case Studies,” Journal of the American Statistical Association 105, no. 490 (2010): 493–505, doi.org/10.1198/jasa.2009.ap08746; Alberto Abadie, “Using Synthetic Controls: Feasibility, Data Requirements, and Methodological Aspects,” Journal of Economic Literature 59, no. 2 (2021): 391–425, doi.org/10.1257/jel.20191450, including the advice to leave teams that received a similar shock out of the comparison pool. ↩
- Andrew Gelman and Eric Loken, “The Statistical Crisis in Science,” American Scientist 102, no. 6 (2014). Their name for it is the garden of forking paths. ↩
- Timothy G. Conley and Christopher R. Taber, “Inference with ‘Difference in Differences’ with a Small Number of Policy Changes,” Review of Economics and Statistics 93, no. 1 (2011): 113–125. doi.org/10.1162/REST_a_00049. ↩
- Brantly Callaway, “Difference-in-Differences for Policy Evaluation,” in Handbook of Labor, Human Resources and Population Economics (Springer, 2022); Jonathan Roth, “Pretest with Caution: Event-Study Estimates after Testing for Parallel Trends,” American Economic Review: Insights 4, no. 3 (2022): 305–322, doi.org/10.1257/aeri.20210236; Ashesh Rambachan and Jonathan Roth, “A More Credible Approach to Parallel Trends,” Review of Economic Studies 90, no. 5 (2023): 2555–2591, doi.org/10.1093/restud/rdad018. The drift calculation here is a simple deterministic cousin of their sensitivity analysis. ↩
- Leonard J. Tashman, “Out-of-Sample Tests of Forecasting Accuracy: An Analysis and Review,” International Journal of Forecasting 16, no. 4 (2000): 437–450; Rob J. Hyndman and George Athanasopoulos, Forecasting: Principles and Practice, 3rd ed. (OTexts, 2021), on time-series cross-validation. ↩
- Anastasios N. Angelopoulos and Stephen Bates, “A Gentle Introduction to Conformal Prediction and Distribution-Free Uncertainty Quantification” (arXiv:2107.07511). ↩